
Crypto markets are bracing for the long-awaited FOMC meeting this Week, and the BTC/USD price is pushing higher in anticipation.
Bitcoin is climbing as traders position for an interest-rate cut at this week’s Federal Reserve meeting, a move that could shape sentiment across both crypto and traditional markets.
As of Monday, Bitcoin (BTC) was hovering near $113,600, extending its rebound from the previous week.
Investors are widely expecting the Fed to trim borrowing costs when the Federal Open Market Committee meets in Washington on Oct. 28–29.
The policy statement is scheduled for 2 p.m. ET on Wednesday, followed by Chair Jerome Powell’s press conference half an hour later.
How Likely Is a 25-Basis-Point Rate Cut at the October FOMC Meeting?
Expectations for a cut have grown since September inflation data showed a mild cooling trend, reinforcing bets that the Fed may ease policy to support growth.
According to CME Fed-funds futures, markets now price in an almost certain 25-basis-point reduction, bringing the target range to 3.75%-4.00 %.
Reuters reported that September CPI rose +3% year over year, a touch below the 3.1% forecast. The softer print keeps the door open for more easing.
Bitcoin opened the week in a tight range, trading between $111,271 and $113,869. Liquidity was thin after the weekend, and many desks hedged risk ahead of the Fed decision.
In rates, the question is whether cooler inflation can stick. Fitch’s Olu Sonola said the Fed would likely be “happy with inflation staying around 3% for the next couple of months,” a setup that could allow gradual cuts while the labor market is watched for stress.
The policy statement will be released on Wednesday, October 29, at 2:00 p.m. ET. Chair Jerome Powell speaks at 2:30 p.m. ET. The Core PCE, the Fed’s preferred inflation gauge, is scheduled to arrive on Friday, Oct. 31, after the meeting, meaning officials will set policy without the update.
DISCOVER: 9+ Best High-Risk, High-Reward Crypto to Buy in 2025
Bitcoin Price Prediction: Is Bitcoin Repeating Its 2020 Covid Crash Recovery Pattern?
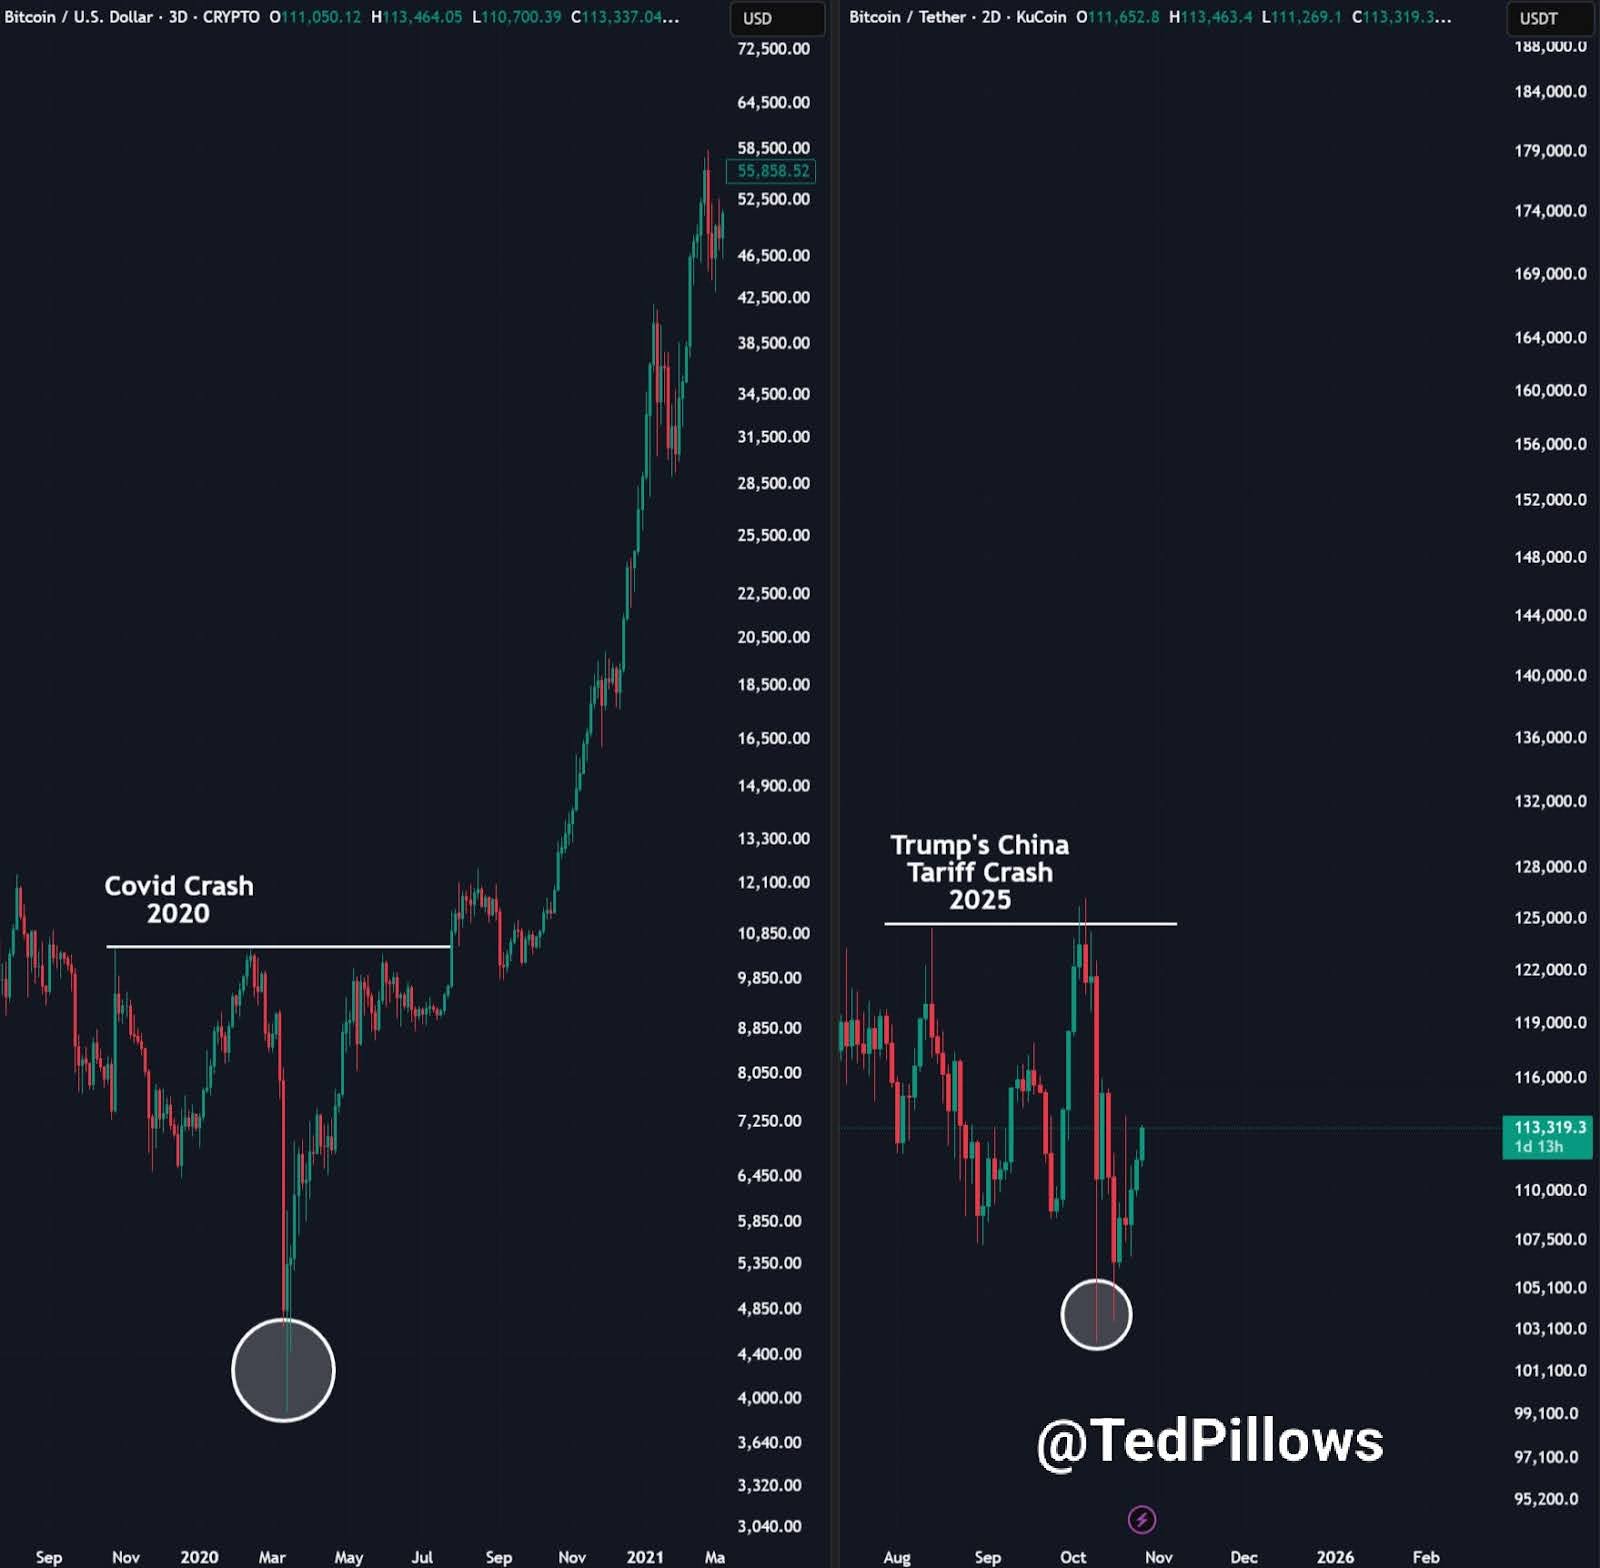
Bitcoin’s price recovery is drawing attention for its similarities to the 2020 Covid crash rebound, analyst Ted Pillows said in a recent post on X.
$BTC reversal from the tariff’s crash is mimicking the March 2020 timeline.
I know a lot of people are calling for a cycle top, but I feel the 4-year cycle might be over now. pic.twitter.com/WzIkEEgY1Q
— Ted (@TedPillows) October 26, 2025
He shared a chart showing how the current “Trump’s China Tariff Crash” pattern in 2025 mirrors the March 2020 bottom. Both show steep declines followed by quick, V-shaped recoveries.
(Source: X)
In early 2020, Bitcoin fell below $4,000 before starting a steady rally that pushed it past $60,000.
The recent 2025 structure looks much the same a sharp drop to around $100,000, then a quick rebound above $110,000.
From a technical perspective, this setup suggests a possible reversal. The support is symmetrical, as is the rebound candle, indicating that buyers of the dips are on board and that the selling force may be downplaying.
Momentum will indicate that Bitcoin can create a higher low signal, which may be the beginning of a new long-term uptrend.
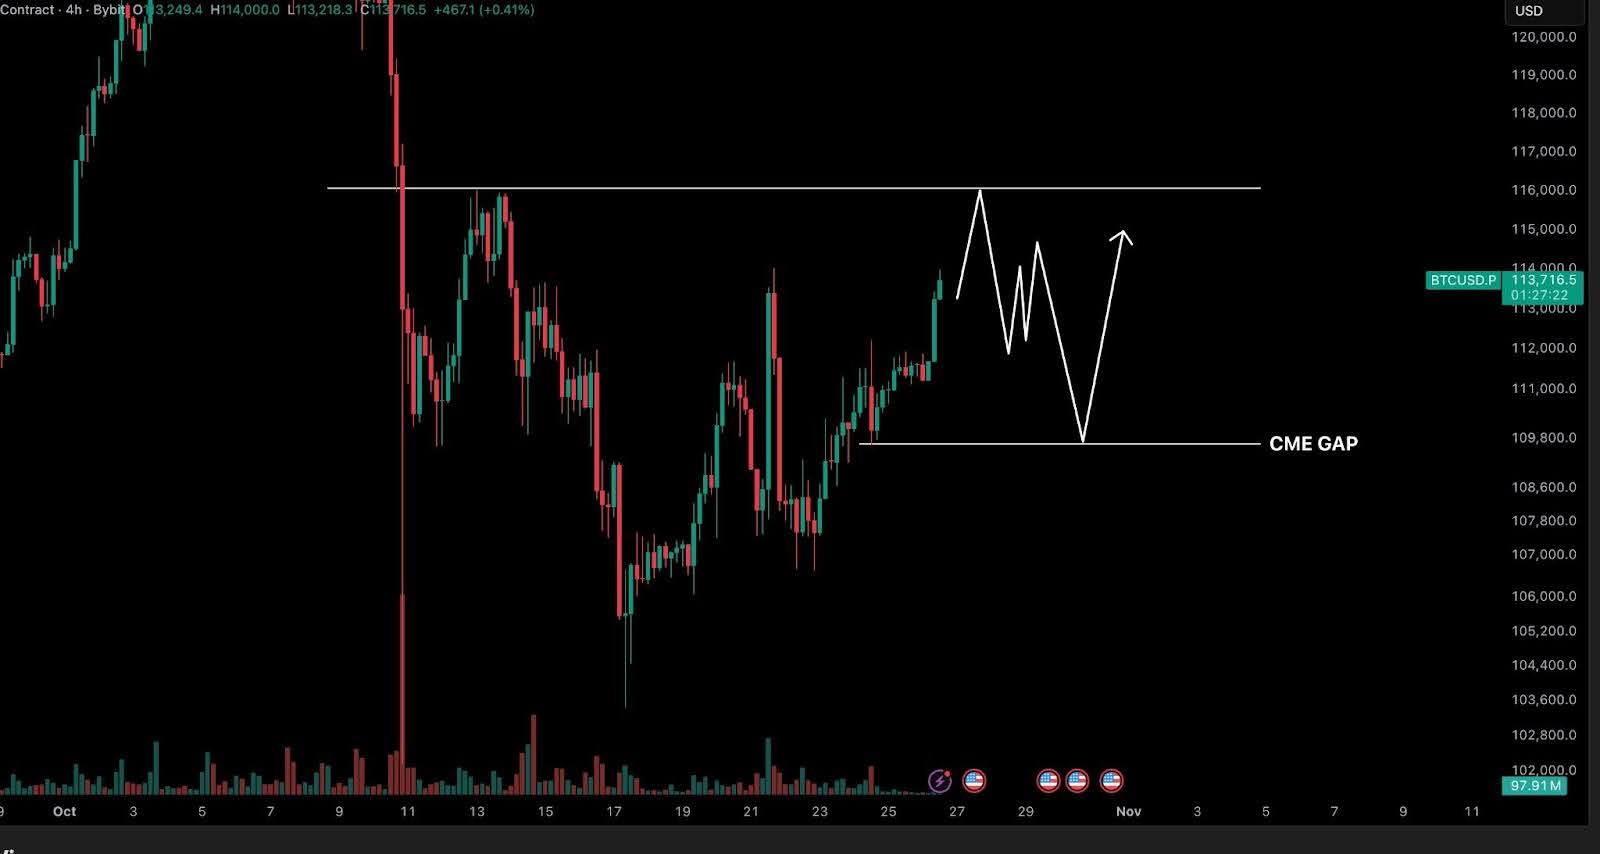
On the other hand, Crypto Tony, a prominent cryptocurrency analyst, observed that the 4-hour chart price action indicates a short-term consolidation period, with Bitcoin trading between the $109,800 and $115,800 ranges.
His view suggests a possible dip toward the lower end of that range before another attempt higher.
The chart reflects a gradual series of higher lows, a pattern that often supports continued upward pressure.
(Source: X)
Nevertheless, traders observe the CME gap around $109,800, which may attract prices in the short term, and then the breakout will become more obvious.
In the meantime, market participants are wary, and the prevailing levels are viewed as the possible peak of the cycle. However, other analysts, such as Pillows, believe that there are parallels to the recovery trend of 2020.
He claims that the four-year market cycle can have potentially bottomed out sooner than previously anticipated and is poised to Bitcoin at the beginning of a more protracted bullish period.
The volume is not showing any significant changes, indicating that traders are waiting for a definitive signal to emerge.
It might be immediately followed by a short-term correction that bridges the CME gap, a phenomenon that has been very common in Bitcoin’s chart in the recent past, before the subsequent surge.
For now, Bitcoin’s outlook remains cautiously positive, but it is open to a short-term pullback. If the $110,000 support holds, momentum could build again early next week.
But if that floor breaks, sellers might regain control, pushing prices back toward the mid-$100,000 zone.
DISCOVER: The 12+ Hottest Crypto Presales to Buy Right Now
Why you can trust 99Bitcoins
Established in 2013, 99Bitcoin’s team members have been crypto experts since Bitcoin’s Early days.
90hr+
Weekly Research
100k+
Monthly readers
50+
Expert contributors
2000+
Crypto Projects Reviewed


Follow 99Bitcoins on your Google News Feed
Get the latest updates, trends, and insights delivered straight to your fingertips. Subscribe now!
Subscribe now ![]()
![]()